"Why 2021 could be turning point for tackling climate change" Topic
27 Posts
All members in good standing are free to post here. Opinions expressed here are solely those of the posters, and have not been cleared with nor are they endorsed by The Miniatures Page.
Please don't make fun of others' membernames.
For more information, see the TMP FAQ.
Back to the Science Plus Board
Areas of InterestGeneral
Featured Hobby News Article
Featured Link
Featured Showcase Article
Featured Workbench Article The pros and cons of plastic in palette knifes.
Featured Profile Article Report from Day One!
Featured Book Review
|
Please sign in to your membership account, or, if you are not yet a member, please sign up for your free membership account.
| Tango01 | 09 Jan 2021 1:01 p.m. PST |
"Covid-19 was the big issue of 2020, there is no question about that. But I'm hoping that, by the end of 2021, the vaccines will have kicked in and we'll be talking more about climate than the coronavirus. 2021 will certainly be a crunch year for tackling climate change…"
Main page
link Amicalement
Armand |
 Editor in Chief Bill Editor in Chief Bill   | 09 Jan 2021 4:07 p.m. PST |
|
| Oddball | 11 Jan 2021 6:38 a.m. PST |
|
| Tango01 | 12 Jan 2021 12:42 p.m. PST |
|
14Bore  | 07 Feb 2021 11:09 a.m. PST |
The sun spots could come back but doubt it |
| Wolfhag | 07 Feb 2021 4:04 p.m. PST |
You could change the title from "Why 2021 could be turning point for tackling climate change" to "Why 2021 could or could not be the turning point for tackling climate change." I think it's true, there is more money in subsidizing climate change (a losing business model) than vaccines. Wolfhag |
| rjones69 | 08 Feb 2021 6:58 a.m. PST |
The sun spots could come back but doubt it Climate change is not caused by sunspots. Fluctuations in the Sun's activity the 11-year solar cycle in solar radiation and the number of sunspots are NOT correlated with increases in the Earth's temperature.
SUNSPOTS:
link
(see the plots of temperature vs. time (black curve) compared to the number of sunspots vs. time (blue curve))
SOLAR IRRADIANCE:
link
(if there's a problem getting to the link directly, just Google "What is the sun's role in climate change NASA" and you can get there that way). (By the way, I was able to go directly to the link above on my IPhone but needed to get there by Google search on my MacBook Pro. If you still have problems seeing the plot go to: link )
The 11-year solar cycle, both in terms of sunspots and solar radiation, is not correlated with increases in global temperatures at all.
|
| USAFpilot | 08 Feb 2021 3:09 p.m. PST |
Climate change has been going on for hundreds of millions of years. Next. |
| rjones69 | 09 Feb 2021 6:55 a.m. PST |
Climate change has been going on for hundreds of millions of years. Next. The rates at which CO2 and methane are increasing are NOT due to the Earth's natural CO2 and methane cycles. Current increases are occurring HUNDREDS of TIMES FASTER than the natural cycles. The rate at which CO2 is currently increasing is ~200 times FASTER than the rate expected from the natural CO2 cycle. The rate at which methane is increasing since the industrial revolution is 80-300 times FASTER than the natural rate.
Here are the CO2 and methane data:
THE NATURAL CYCLE
CURRENT LEVELS
link
link
link (click on Figure 2 to see the methane concentration data).
The data above are discussed in more analytical detail on this thread in the Miniatures Page:
TMP link
For at least the last 800,000 years the atmospheric concentrations of CO2 and methane have each followed a natural cycle, dropping during Ice Ages and rising during the periods between Ice Ages. During this natural cycle, after the end of an Ice Age C02 levels rise to 200-280 parts per million (ppm). Current C02 levels are ~415 ppm, beyond and completely inconsistent with the 200-280 ppm levels of the natural CO2 cycle observed over at least 800,000 years. Current methane levels are ~1800 parts per billion (ppb), far beyond and completely inconsistent with the 600-800 ppb levels of the natural methane cycle. The RATE at which these atmospheric concentrations is increasing are also completely inconsistent with the natural cycle. The rate at which CO2 is currently increasing is ~200 times FASTER than the rate expected from the natural CO2 cycle: 2 ppm/year vs. the natural rate of 0.01 ppm/ year. The rate at which methane is increasing since the industrial revolution is 80-300 times FASTER than the natural rate: 2.8 ppb/year to 11 ppb/year instead of the natural cyclical increase of 0.035 ppb/year.
To put it another way: changes in CO2 and methane levels that naturally take place over hundreds of centuries (~10,000 20,000 years) are now taking place over 1 or 2 centuries (100 250 years), or even less than a century (i.e., 50 -65 years).
Since CO2 and methane are increasing at a rate 80-300 times faster than the natural cycle, and over time scales of 1-2 centuries when the natural time scale is increases over 100-200 centuries, one thing is absolutely clear: this IS NOT the natural cycle! |
| Tango01 | 12 Feb 2021 9:50 p.m. PST |
Thanks!.
Amicalement
Armand
|
| Wolfhag | 15 Feb 2021 1:26 p.m. PST |
What did the IPCC say about a solution or what we can do about it this time? Wolfhag |
| Martin From Canada | 15 Feb 2021 4:58 p.m. PST |
What did the IPCC say about a solution or what we can do about it this time? IPCC Working Group III
Climate change mitigation is achieved by limiting or preventing greenhouse gas emissions and by enhancing activities that remove these gases from the atmosphere. Greenhouse gases can come from a range of sources and climate mitigation can be applied across all sectors and activities. These include energy, transport, buildings, industry, waste management, agriculture, forestry, and other forms of land management.Working Group III supports the IPCC's solution-oriented approach but does not advocate any specific mitigation options. It takes both a near-term perspective relevant to decision-makers in government and the private sector and a long-term perspective that helps identify how high-level climate policy goals might be met. Working Group III addresses all aspects of mitigation including technical feasibility, cost and the enabling environments that would allow measures to be taken up. Enabling environments cover policy instruments, governance options and social acceptability. Synergies and trade-offs with adaptation measures are of increasing interest as are co-benefits, risks and links to sustainable development. To meet these needs, Working Group III is highly interdisciplinary in character. link Full report: ipcc.ch/report/ar5/wg3 |
| Tango01 | 15 Feb 2021 10:15 p.m. PST |
Thanks Martin!… (smile)
Amicalement
Armand
|
| Martin From Canada | 16 Feb 2021 12:53 p.m. PST |
The IPCC is so bent on world domination that they … (Check notes) let national governments develop their own strategy and only provide non-binding advice on how well that strategy will advance the goals of mitigation. |
| von Schwartz ver 2 | 17 Feb 2021 4:39 p.m. PST |
+1 USAF Pilot Don't know how long they've been around but I was born and lived in Minnesota for 58 years and sometimes we had really cold winters and sometimes not. Climate change right, no, just normal climate cycles, from El Nino, La Nina, and sunspots. Al Gore and all the so called climate scientists predicted that, according to their models, the US East Coast, Hawaii, Florida large swathes of western Europe and Australia would be under water in 20 years, that was back in the 1980s….next. And BTW would you please stop trying to bore us into a stupor with the "Models"? In addition to being stupefyingly boring, and completely incomprehensible they haven't been close to being right for over 50 years.
This same garbage was going on in the late 50s and early 60s. Back then it was the coming ice age, then in the later 70s it was global warming, then since they didn't have a clue they made it global climate change so they could lump everything from hurricanes to volcanoes to tsunamis under one umbrella. Too hot, climate change; too cold, climate change; just right, climate change. The solution, throw several trillion dollars at it and ruin your economies then it all be better. |
| rjones69 | 18 Feb 2021 9:23 p.m. PST |
No, von Schwartz, this is NOT the normal climate cycle. As the data and analysis I've presented in my previous posts clearly show, the atmospheric concentration of CO2 and methane are increasing at a rate 80-300 times FASTER than the natural cycle, and over time scales 100 times SHORTER than the natural cycle: increases over 1-2 centuries when the natural time scale is increases over 100-200 centuries. When things are increasing at a rate HUNDREDS of times FASTER than the natural cycle, over time scales that are a HUNDRED times SHORTER than the natural cycle, one thing is absolutely clear: this IS NOT the natural cycle! Rather, this recent and rapid increase in CO2 and methane levels is due to the hundreds of billions of tons of C02, and billions of tons of methane, we've dumped into the atmosphere since the Industrial Revolution. And we're currently emitting several billions of tons of CO2 and hundreds of millions of tons of methane each year. And since the carbon dioxide molecule CO2 and the methane molecule CH4 absorb infrared photons re-radiated from the Earth, carbon dioxide and methane are greenhouse gases that warm the atmosphere. Which means the increasing atmospheric concentrations of these greenhouse gases C02 and methane are resulting in increased warming of the atmosphere. |
| Martin From Canada | 20 Feb 2021 9:49 a.m. PST |
Don't know how long they've been around but I was born and lived in Minnesota for 58 years and sometimes we had really cold winters and sometimes not. Climate change right, no, just normal climate cycles, from El Nino, La Nina, and sunspots. Nope, I was born in 1988 and I've never known a month in which the global average temperature anomaly was negative (meaning that the temperature is warmer than the 1951-1980 baseline). link
Al Gore and all the so called climate scientists predicted that, according to their models, the US East Coast, Hawaii, Florida large swathes of western Europe and Australia would be under water in 20 years, that was back in the 1980s….next. 1) Al Gore isn't a scientist.
2) That was a remark off the cuff when asked by a reporter about what he thought was a worst case scenario (aka rolling 1 5+ times in a row).
3) The coasts are flooding more than in the past during storms, but this is also being mitigated by new infrastructure.
This same garbage was going on in the late 50s and early 60s. Back then it was the coming ice age, then in the later 70s it was global warming, then since they didn't have a clue they made it global climate change so they could lump everything from hurricanes to volcanoes to tsunamis under one umbrella. Too hot, climate change; too cold, climate change; just right, climate change. The solution, throw several trillion dollars at it and ruin your economies then it all be better.
I've explained it here often, but in 1950s we didn't know better about which process would net out stronger the cooling effects of SO2 or the warming effects of CO2. Furthermore, the Earth is in a cooling part of a Milankovitch cycle link , so absent any intervention, the earth would default to cooling. But as we got more data, we can see that the signal from CO2 nets out stronger and thus we have the warming. Thankfully, we have more data now than we did in the 1970s, so most of the data collection is more on the refinement side rather that creation of paradigm side of things. |
| von Schwartz ver 2 | 21 Feb 2021 5:21 p.m. PST |
No, von Schwartz, this is NOT the normal climate cycle. Just where did all this CO2 and methane come from? The earth is a closed cycle, it was always here and will always be here.
And who says things are increasing hundreds of time faster, the media, scientists who have made their living by hyping so called climate science, those who get millions of dollars in grant money year to write horror stories about the planet only having 10, 12, or 15 years left?
No, they have been pumping that $hit into the mainstream media for decades. Now they have classified CO2 as a toxic gas. They seem to forget that everything on this planet depends on this "Toxic gas" to live. Without CO2, trees, grass, crops don't grow. Herbivores who live on them die, carnivores who eat the herbivores die, human who consume both cease to exist. So, lets get rid of all the CO2 and see how long it takes. Besides, you people seem to be forgetting the fact that 97% of the atmospheric CO2 come from the oceans, not from human activity. How do you intend to stop that? |
| Martin From Canada | 22 Feb 2021 7:40 a.m. PST |
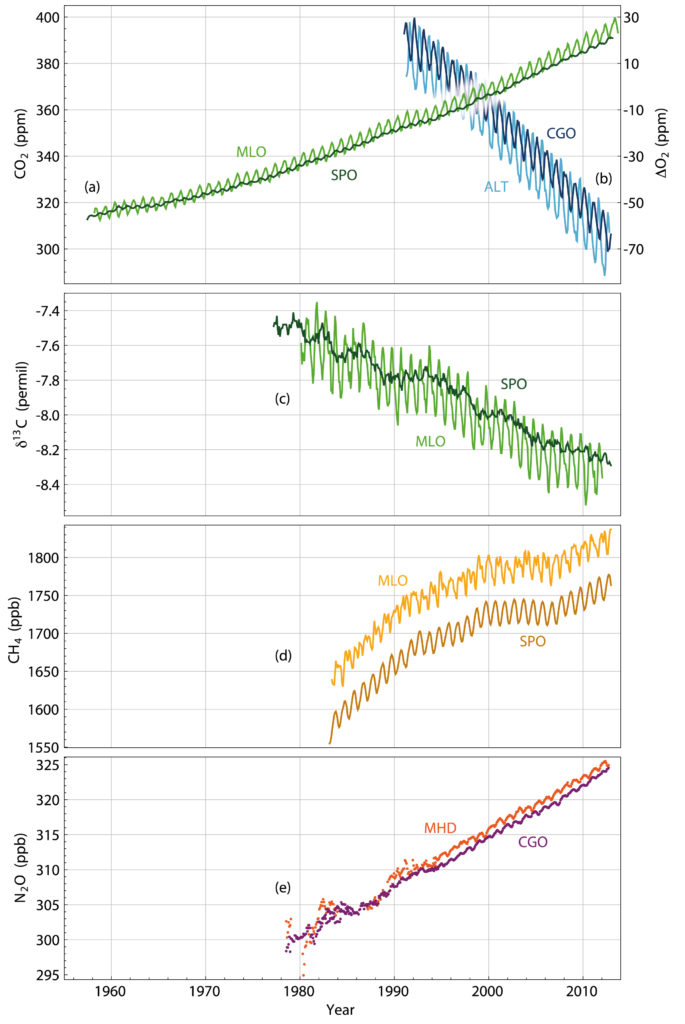
Just where did all this CO2 and methane come from? Vast majority of it? Burning fossil fuels. How do we know that? Here's a graphic from the 5th IPCC report (WG1, Chapter 6)
From the IPCC's 5th report: (Emphasis mine) 6.1.3.2 OxygenAtmospheric oxygen is tightly coupled with the global carbon cycle (sometimes called a mirror of the carbon cycle). The burning of fossil fuels removes oxygen from the atmosphere in a tightly defined stoichiometric ratio depending on fuel carbon content. As a consequence of the burning of fossil fuels, atmospheric O2 levels have been observed to decrease steadily over the last 20 years (Keeling and Shertz, 1992; Manning and Keeling, 2006) (Figure 6.3b). Compared to the atmospheric oxygen content of about 21% this decrease is very small; how-ever, it provides independent evidence that the rise in CO2 must be due to an oxidation process, that is, fossil fuel combustion and/or organic carbon oxidation, and is not caused by, for example, volcanic emissions or by outgassing of dissolved CO2 from a warming ocean. The atmospheric oxygen measurements furthermore also show the northsouth concentration O2 difference (higher in the south and mirroring the CO2northsouth concentration difference) as expected from the stronger fossil fuel consumption in the NH (Keeling et al., 1996). On land, during photosynthesis and respiration, O2 and CO2 are exchanged in nearly a 1:1 ratio. However, with respect to exchanges with the ocean, O2 behaves quite differently from CO2, because com-pared to the atmosphere only a small amount of O2 is dissolved in the ocean whereas by contrast the oceanic CO2 content is much larger due to the carbonate chemistry. This different behaviour of the two gases with respect to ocean exchange provides a powerful method to assess independently the partitioning of the uptake of anthropogenic CO2 by land and ocean (Manning and Keeling, 2006)
In the top most figure, we see the a corresponding decrease in atmospheric O2 that corresponds with the increase in carbon dioxide in the atmosphere. Furthermore, we can deduce that the increased CO2 is fossil in origin due to the decrease in atmospheric Carbon14 concentrations (Most C14 us made in the upper atmosphere from solar radiation (simplifying a bit here) and is thus continually replenished. (with a halflife of about 5.3Ky, a source of replenishment is needed)
The decrease in Carbon14 (save for that brief period of irrational exuberance when the USA and the USSR (and others) were blowing up nukes like fireworks) points to a reservoir of carbon that hasn't been in the upper atmosphere for a long time buried just like fossil fuels. And just like a bunch of cyclists got busted for using synthetic testosterone in the mid-2000s since the C14 isotope ratio of their testosterone didn't match their tissue's C14 ratio, C14 a smoking gun (amongst a horse and musket firing line of smoking guns) linking increased CO2 concentrations to human activities. |
| Martin From Canada | 22 Feb 2021 8:47 a.m. PST |
those who get millions of dollars in grant money year to write horror stories about the planet only having 10, 12, or 15 years left? That's a gross misunderstanding on both how funding works and the years left. As for the "years left thing", the best wing of thinking about it is akin to fuel in an airplane and keeping enough fuel in the tank to make it to an airport. As it stands right now, we have about 10 to 15 years to get to start reversing our net CO2 contributions before we have less than a 66% chance of limiting global warming to 1.5C above pre-industrial temperatures*, and the plane isn't really heading towards a nearby airport. That being said, once you cross that point of no return there's no earth-shattering kaboom. It just means that we've locked-in more warming. And while we're on the subject of more warming, that doesn't mean that 1.49999 is materially better than 1.500001, but in every measurable way, 1.5 is better than 2 which is much better than 3. Now with regards to funding, scientists don't really directly benefit from grants. With the obvious caveats of having a job/summer funding** and buying out teaching obligations, but those salaries are set by the institution at which they work and it doesn't really change if they bring in 6 figures or 7. Speaking of institutions, most take 40 to 60% off the top for office and lab space, lights ect, then you have to fund your supports staff, grad student stipend and tuition, lab equipment…
*A lot of that uncertainty depends on some assumptions we plug into the model and how effective we are at sucking CO2 from the air 50 years from now. And this exercise is a bit like retirement planning – the higher the interest rate you assume, the less you have to save, but in this case it's the more effective carbon sinks and sequestration assumptions you make, but less you need to cut upfront. I'll just say that some of those assumptions are mighty heroic.
** Many university positions only pay for 8 months of the year and research funding pays for the summer months, where rather than vacation, you're doing what you would rather do – which is research.
|
| rjones69 | 22 Feb 2021 12:24 p.m. PST |
II. CO2 AND METHANE RATE OF INCREASE
And who says things are increasing hundreds of time faster, the media, scientists who have made their living by hyping so called climate science, those who get millions of dollars in grant money Elementary school math says things are increasing hundreds of times faster. I didn't get those rates of change from the media or from climate scientists. I calculated those numbers directly from the scientific data using elementary school math.
Specifically,
All I did was present several graphs of scientific data, find the minima and maxima (i.e., the lowest points and the highest points on the graph), and calculate the rate of change (i.e., the slope) at different time periods using subtraction and division. .
Which you should have understood by now in 2021, von Schwartz. Because that quote is literally word-for-word my response to you when we dealt with exactly the same lack of understanding on your part, on exactly the same numbers, using exactly the same data, right here on TMP in July of 2019!
In this current thread I've already presented the link to that TMP discussion. Here's the link again:
TMP link
A) ATMOSPHERIC CO2 LEVELS
From that TMP discussion in 2019, here's how one calculates the rate of change for CO2, using simple subtraction and division (i.e., elementary school math):
From the end of the last Ice Age to 1950, the C02 level increased by ~100 ppm (~180 ppm to ~315 ppm, so ~135 ppm rounded down to 100) over 10,000 years. So the minimum is ~180 ppm, the maximum is ~315 ppm. Subtraction leads to ~135 ppm, rounded down to 100 ppm. Dividing 100 ppm by 10,000 years gives 0.01 ppm/year
Similarly,
From 1950 to 2013, the C02 level increased from ~100 ppm (~315 ppm to ~415 ppm) over ~50 years. Dividing 100 ppm by 50 years gives 2 ppm/year
And thus we see that the rate at which CO2 is currently increasing is ~200 times FASTER than the rate expected from the natural CO2 cycle: 2 ppm/year vs. the natural rate of 0.01 ppm/ year.
B) ATMOSPHERIC METHANE LEVELS
I did the equivalent calculation for methane in 2019:
Since the end of the last Ice Age to the beginning of the industrial era (i.e., middle of the eighteenth century, ~1750), methane levels increased by ~350 ppb (from ~350 ppb to ~700 ppb) over ~10,000 years. This is totally natural and expected.However from 1750 to 2015, the methane level increased by ~1000 ppb (~700 ppb to ~1800 ppb, so ~1100 ppb rounded down to 1000 ppb) over ~250 years. 350 ppb over 10,000 years = 0.035 ppb/year
700 ppb over 250 years = 2.8 ppb/year Thus from the end of the last Ice Age methane levels were increasing at a rate of 0.035 ppb per year. However since ~1750 ppb levels have been increasing at a rate of 2.8 ppb per year. So the methane level increased at a rate ~80 times FASTER than the natural increase because of the end of the last Ice Age. And this increase in methane levels at a rate far higher than can be explained by a natural rise is confirmed by more recent data. From 1840 to 1950, methane levels increased from ~800 ppb to 1,100 ppb. So that's a 300 ppb increase over ~100 years, i.e., a rate of 3 ppb/year, a rate ~85 times FASTER than the natural increase because of the end of the last Ice Age. From 1950 to 2015, methane levels increased from 1,100 ppb to 1,800 ppb. So that's a 700 ppb increase over 65 years, i.e., a rate of 11 ppb/year, a rate ~300 times FASTER than the natural increase because of the end of the last Ice Age.
And thus we see that the rate at which methane is increasing since the industrial revolution is 80-300 times FASTER than the natural rate: 2.8 ppb/year to 11 ppb/year instead of the natural cyclical increase of 0.035 ppb/year.
And this is how we know things are increasing hundreds of times faster than the natural cycles for carbon dioxide and methane.
Now, von Schwartz, as the quotes highlighted in white indicate, I went over all this with you back in 2019. My thought process then was: (i) let me do the calculations myself, so I'm not relying on someone else ("the media, [other] scientists…"); (ii) let me make sure my calculations use only elementary school math (find the minimum, find the maximum, do a subtraction, do a division). That way, anyone else can easily understand my calculations and replicate the calculations themselves.
However, von Schwartz, in July 2019 you couldn't understand that very simple elementary school math. By your own admission, you didn't understand "WHAT THE HELL" I was talking about. Here is your post from July 15, 2019:
No one, except maybe you, even knows WHAT THE HELL you're talking about! Well, I'll get further talking to the rock in my back yard. You've obviously drank the Kool-Aid, I think perhaps you MADE the Kool-Aid. Enjoy the end of the world, I'm out. . And here is my direct response from July 16, 2019, where I have to spell out to you that I'm doing simple subtraction and division: So the answer is NO, you have no evidence of any falsification of the Vostok and Dome C data. But instead of simply and honestly answering my question and demonstrating intellectual integrity by acknowledging the fact that you have no evidence, you duck my question three times in a row (in your July 11 post, your July 12 post, and your July 15 post) and then pick up your marbles and go home.
However, there is one statement in your most recent post (the July 15 post) where you and I are in complete agreement. I completely agree that, to quote your own words from your own post, you don't "[know] WHAT THE HELL [I'm] talking about". Your repeated errors of fact and logic leave no doubt as to your total lack of understanding, for example
a) mistaking the plots in my post for hockey stick plots, when in fact they had nothing to do with hockey stick plots; b) saying that the charts "prov[ed] [your] point, change is at best negligible and perfectly in line with what is considered planetary cycles" when in fact the charts proved exactly the OPPOSITE of your point: the charts proved that the change is a factor of ~100 times out of line with what is considered planetary cycles and is not negligible; c) complaints/comments/accusations/gripes/etc. about 20-year-old and 40-year-old predictions and arguments, when the Vostok and Dome C data I used wasn't even available 20 years ago, much less 40 years ago.
However, just because YOU don't understand the data and calculations I presented von Schwartz doesn't mean NO ONE ELSE understands. Especially since it's not that hard to understand. All I did was present several graphs of scientific data, find the minima and maxima (i.e., the lowest points and the highest points on the graph), and calculate the rate of change (i.e., the slope) at different time periods using subtraction and division.
Now perhaps where you come from looking at a graph and doing subtraction and division is called "drinking or making the Kool-Aid". But where I come from, we call looking at a graph and doing subtraction and division "elementary school math". And we can understand "WHAT THE HELL" elementary school math is saying without any problem at all. . Now at this point in July 2019 I was naive enough, von Schwartz, to believe that you finally understood the very simple concept of looking at a graph and doing subtraction and division "elementary school math" to calculate the rate of change. But here we are in February 2021, nearly two years later, and you ask "who says things are increasing hundreds of time faster, the media, scientists…". And you're asking this about literally exactly the same numbers and exactly the same data for which this question was answered nearly two years ago in 2019. And where the link to that answer was provided to you in one of my previous posts in this thread. Which tells me you're paying no attention to these numbers and to this data, because you have a total lack of understanding of what these numbers and what this data mean. That, von Schwartz, you have a total lack of understanding of this data, and the numbers calculated from it using simple math, was self-evident in 2019. It was self-evident in 2019 when you said that charts that proved exactly the OPPOSITE of your point "prov[ed] [your] point, change is at best negligible and perfectly in line with what is considered planetary cycles". It was self-evident in 2019 when you didn't understand how to use subtraction and division to get a simple rate of change from a simple graph. And, unfortunately, your total lack of understanding is still self-evident in 2021 when you demonstrate that you still don't understand how to get a simple rate of change by looking at a graph and doing subtraction and division. I was planning to address the other errors in your post, von Schwartz, in detail (thus this is Part II of three parts). But I'll address them later, because quite frankly, von Schwartz after having to write this amount of material for the second time in two years explaining how to apply subtraction and division to a simple graph, I'm too tired and I'm too disgusted. |
| rjones69 | 22 Feb 2021 12:30 p.m. PST |
Thanks, Martin, for addressing where the CO2 and methane come from. That was going to be Part I of my response to von Schwartz, but I don't need to write that. |
| rjones69 | 22 Feb 2021 1:42 p.m. PST |
Besides, you people seem to be forgetting the fact that 97% of the atmospheric CO2 come from the oceans, not from human activity. How do you intend to stop that? PART III. CO2 IN THE OCEANS I'm still tired, so I'll provide the details later, but I can't allow the worst of the scientific errors in your post to remain unanswered von Schwartz. "97% of the atmospheric CO2 come from the oceans, not from human activity"???!!! Where in the hell did you get that NONSENSE from? The oceans are a carbon dioxide SINK not a SOURCE. The oceans have absorbed ~38% of all the carbon dioxide emitted by human activity since the Industrial Revolution. So we're not forgetting anything, von Schwartz, because it's not true. And we don't intend to stop it, because it's not happening. |
| Martin From Canada | 22 Feb 2021 3:49 p.m. PST |
Thanks, Martin, for addressing where the CO2 and methane come from. That was going to be Part I of my response to von Schwartz, but I don't need to write that. No problem. I've been at this for years on the science page, so it was a simple matter of dredging up old stuff (And I've see that you're doing that as well). But to be honest, they don't really have any new arguments in years. |
| USAFpilot | 25 Feb 2021 4:50 p.m. PST |
Does anyone really think the biggest polluters in the world (China, India, Africa) are going to comply with costly environmental measures? |
| Tumbleweed | 26 Feb 2021 8:53 p.m. PST |
Right on, USAFpilot. And you didn't need a long-winded doctoral dissertation to make your point. |
| rjones69 | 27 Feb 2021 5:06 p.m. PST |
Does anyone really think the biggest polluters in the world (China, India, Africa) are going to comply with costly environmental measures? Whether or not the biggest polluters are going to address what's happening with increasing CO2 and methane levels is a POLITICAL and ECONOMIC question. Whether or not those C02 and methane levels are increasing at rates hundreds of times faster than the natural cycle, and are caused by the burning of fossil fuels, is a SCIENTIFIC question. And that scientific question is clearly answered by the scientific data on C02 and methane levels, and the numbers calculated directly from that scientific data: (a) CO2 and methane levels are increasing at a rate HUNDREDS of times FASTER than the natural cycle, over time scales that are a HUNDRED times SHORTER than the natural cycle. Thus one thing is absolutely clear: this IS NOT the natural cycle! (b) The increasing levels of C02 and methane are coming from the burning of fossil fuels. |
|