"New Science paper on "hiatus" or lack thereof" Topic
15 Posts
All members in good standing are free to post here. Opinions expressed here are solely those of the posters, and have not been cleared with nor are they endorsed by The Miniatures Page.
Please remember not to make new product announcements on the forum. Our advertisers pay for the privilege of making such announcements.
For more information, see the TMP FAQ.
Back to the Science Plus Board
Areas of InterestGeneral
Featured Hobby News Article
Featured Link
Featured Ruleset
Featured Showcase Article Well, they're certainly cheap...
Current Poll
|
| Martin From Canada | 05 Jun 2015 11:24 a.m. PST |
I just saw this today, and it looks interesting. The bold and underlines are mine. I think that the paper is open of all, since I was able to open it without my university's proxy server.
link
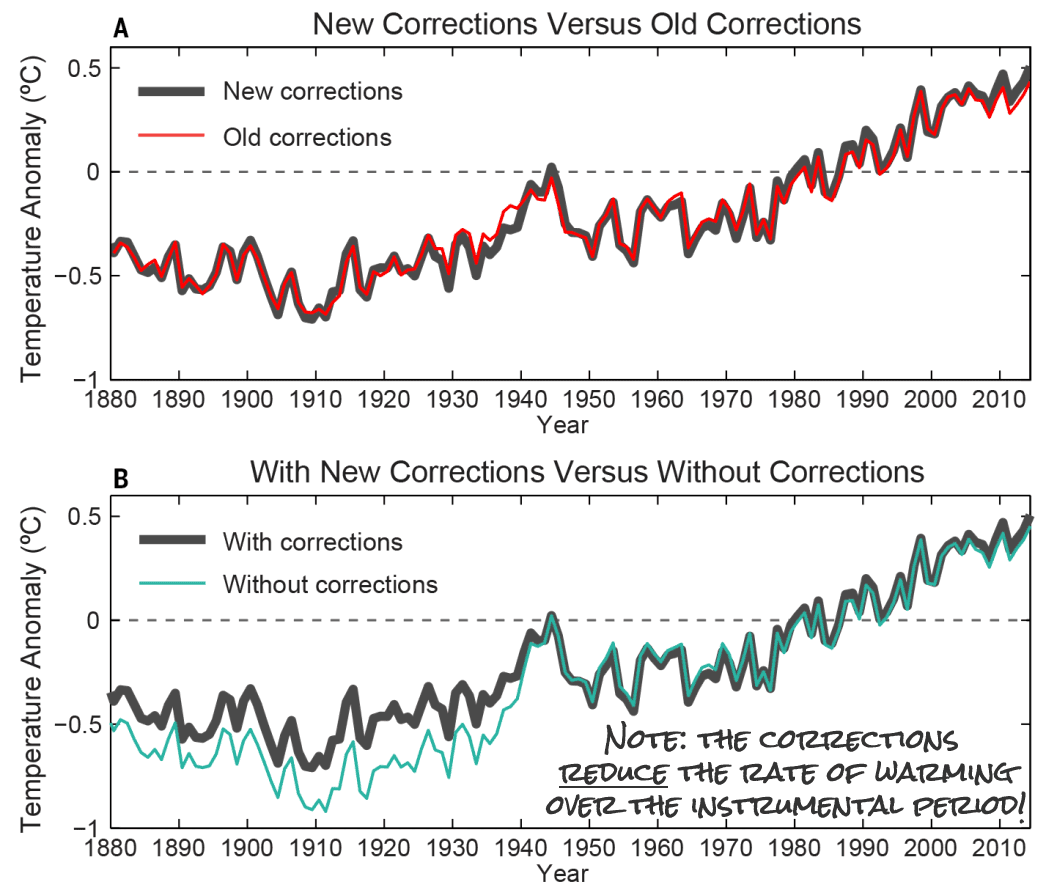
In summary, newly corrected and updated global surface temperature data from NOAA's NCEI do not support the notion of a global warming "hiatus." As shown in Fig. 1, there is no discernable (statistical or otherwise) decrease in the rate of warming between the second half of the 20th century and the first 15 years of the 21st century. Our new analysis now shows the trend over the period 1950-1999, a time widely agreed as having significant anthropogenic global warming, is 0.113°C dec−1, which is virtually indistinguishable with the trend over the period 2000-2014 (0.116°C dec−1). Even starting a trend calculation with 1998, the extremely warm El Niño year that is often used as the beginning ofthe "hiatus", our global temperature trend (1998-2014) is 0.106°C dec−1 and we know that is an un-derestimate due to incomplete coverage over the Arctic. Indeed, based on our new analysis, the IPCC's statement of two years ago that the global surface temperature "has shown a much smaller increasing linear trend over the past 15 years than over the past 30 to 60 years" is no longer valid.
Cheers,
Martin
|
| Winston Smith | 05 Jun 2015 12:47 p.m. PST |
In other words, you can cook and "account for outliers" to say what you want the data to say. |
| RavenscraftCybernetics | 05 Jun 2015 1:04 p.m. PST |
exactly! however, it's still a good idea to plant trees and try not to pollute the atmosphere worldwide. |
| Mr Elmo | 05 Jun 2015 1:14 p.m. PST |
newly corrected See, the old data wasn't reaching the conclusion we wanted showing that there is man made global warming… So we ignored THAT data, kept the data that worked, and… Now we have made made global warming again! EVERYBODY PANIC! |
| Ditto Tango 2 3 | 05 Jun 2015 1:17 p.m. PST |
Didn't go to the link, Martin but what does the unit of measure degees C dec-1 mean? Degrees Celsius per decade?
--
Tim |
| Charlie 12 | 05 Jun 2015 5:51 p.m. PST |
In other words, you can cook and "account for outliers" to say what you want the data to say. Did you actually READ the posting? Or should previously unrecorded data be ignored because it doesn't fit YOUR perception? Really…. 
|
| jpattern2 | 05 Jun 2015 6:27 p.m. PST |
|
| mandt2 | 05 Jun 2015 8:27 p.m. PST |
It's actually explained more clearly for us normal people here: link Elmo and Winston, you should read/listen to this. That said, check this out: link Just read what's in the big yellow box with the label "climate change." Yup. Even, Shell oil (big huge nasty oil company) is concerned about the effect of human generated CO2 in the atmosphere and it's effect on Earth's climate. Dudes, when the oil companies desert your cause, I would think you'd start reconsidering your position on this subject. |
| goragrad | 05 Jun 2015 9:46 p.m. PST |
Let see, when governments are throwing subsidies at 'alternative/green' energy and penalizing fossil fuels, why wouldn't an energy company jump on the bandwagon??? There was a reason for BP to be marketing itself as 'Beyond Petroleum' before the Gulf blowout. The bulk of their research in the preceding years was on how to generate subsidies (aka alternative energy). Why would O&G companies fund 'denial' when they can re-brand to 'green energy,' get subsidies, and still have the petroleum and gas to sell down the road for all of the other purposes for which it is used (plastic, fertilizer, etc.)??? There is no incentive for the oil companies to fight for truth in the climate wars. They will look at the bottom line and if that is taking public money for a pig in a poke they will gladly reconfigure their operations. As to the paper - The greatest changes in the new NOAA surface temperature analysis is to the ocean temperatures since 1998. This seems rather ironic, since this is the period where there is the greatest coverage of data with the highest quality of measurements ARGO buoys and satellites don't show a warming trend. Nevertheless, the NOAA team finds a substantial increase in the ocean surface temperature anomaly trend since 1998.In my opinion, the gold standard dataset for global ocean surface temperatures is the UK dataset, HadSST3. A review of the uncertainties is given in this paper by John Kennedy link Note, the UK group has dealt with the same issues raised by the NOAA team. I personally see no reason to the use the NOAA ERSST dataset, I do not see any evidence that the NOAA group has done anywhere near as careful a job as the UK group in processing the ocean temperatures. I am also unconvinced by NOAA's gap filling in the Arctic, and in my opinion this introduces substantial error into their analysis. I addressed the issue of gap filling in the Arctic in this recent publication: Curry JA, 2014: Climate science: Uncertain temperature trends. Nature Geoscience, 7, 83-84. Relevant text: Gap filling in the Arctic is complicated by the presence of land, open water and temporally varying sea ice extent, because each surface type has a distinctly different amplitude and phasing of the annual cycle of surface temperature. Notably, the surface temperature of sea ice remains flat during the sea ice melt period roughly between June and September, whereas land surface warming peaks around July 1. Hence using land temperatures to infer ocean or sea ice temperatures can incur significant biases. From Judith Curry, Climate, etc. - link So it is another day another explanation for or claim that there is no pause/hiatus… Also from the link a portion of another critique - IS THERE NO "HIATUS" IN GLOBAL WARMING AFTER ALL? Patrick J. Michaels, Richard S. Lindzen, Paul C. Knappenberger While this will be heralded as an important finding, the main claim[2] that it uncovers a significant recent warming trend is certainly dubious. The significance level (.10) is hardly normative and the use of it certainly will prompt many readers to question the reasoning behind the use of such a lax standard. The treatment of the buoy sea-surface temperature (SST) data was guaranteed to put a warming trend in recent data. They were adjusted upwards 0.12°C to make them "homogeneous" with the longer-running temperature records taken from engine intake channels in marine vessels. As has been acknowledged by numerous scientists, the engine intake data are clearly contaminated by heat conduction from the structure, and they were never intended for scientific use. On the other hand, environmental monitoring is the specific purpose for the buoys. Adjusting good data upwards to match bad data seems questionable, and the fact that the buoy network becomes increasingly dense in the last two decades means that this adjustment must put a warming trend in the data. My bold. There is also a critique from the GWPF at Curry's site for those interested in actually seeing some analysis. By the way, if the oil companies are jumping on the CCW/AGW/CAGW gravytrain, who in tarnation is funding all of these deniers??? |
| Martin From Canada | 05 Jun 2015 10:54 p.m. PST |
Tim, it's scientific shorthand for "per decade".
Oh, Pat Michaels et al, the ideological blinders are strong on those guys, since basic algebra would indicate that the trend expressed in the slope form would show that the slope remains identical when you add or subtract to it. For example, if you take Y = MX and I add or substract B, it becomes Y = MX+B or Y = MX-B. Notice that X stays unchanged?
Here's the net result. (I picked the data from Hot Whopper since Sue helpfully annotated the graph. For the original, see the figures after the article I provided):
Furthermore, as for the conspiracy that "Gobmit cookin' da data like meth", you realise that net-net the changes mostly raised the temperatures before 1950 via better matching sea data. It's been well known for a long time that the early sea surface temperature is iffy since the methodology for measuring sea surface temperature consisted of sticking a thermometer in a canvas bucket after it was hoisted to the decks. You don't need an advanced degree to realize that this method gives ambient air conditions undue influence on temperature recordings. Incidentally, for the Ice Age commeth commentary from the 70s, look at the trend from mid 1945s to mid 1970s, which was mostly due to pacific currents and aerosols lowering surface temperatures. |
| mandt2 | 06 Jun 2015 10:03 p.m. PST |
Let see, when governments are throwing subsidies at 'alternative/green' energy and penalizing fossil fuels, why wouldn't an energy company jump on the bandwagon??? It's chump-change compared to the 22 billion in subsidies the oil companies receive every year. It is pennies compared to what the fossil fuel companies stand to lose. The oil companies are still powerful enough to persuade our politicians to go to war for their interests. You are brushing aside thousands of studies, millions of pages of research and data accumulated for decades in favor of the handful of opinions that you find on blogs…which is what the Cato Institute is. It's a conservative blog, isn't it? Why? Do you honestly believe that thousands of experts from all over the world have been actively engaged in some sort of gigantic conspiracy for almost 50 years, and not one has come forward to say that such an organized group exists? By the way, if the oil companies are jumping on the CCW/AGW/CAGW gravytrain, who in tarnation is funding all of these deniers??? That's an odd question. Why would you think that just because Shell oil is recognizing that climate change is happening and modifying their business model to deal with it, that they still aren't pumping huge amounts of cash into misinformation campaigns. Every day they postpone a shift to green technology, is millions more in their coffers. If I was an oil company CEO, that's what I would do. But to answer your question, here's one example of who's paying, and how it actually backfired: link And here's a discussion on the "hiatus." Check out the chart. Yes, temps go up and down (anomalies), and sometimes they have the appearance of a "hiatus," but the reality is revealed in the trendline. Up, up, up it has been going and still is. link Here's a discussion on anomalies and trend lines. link And here is the best overall site (IMHO) for getting to the facts of the climate debate. skepticalscience.com There is also a lot of SciFi on climate change that is misleading. Hollywood has been no help, with it's depictions of massive and sudden catastrophies. That's not how it will hurt. It is much more incremental. a few years back the Arab Spring swept through the Middle East unbalancing the region with violent revolutions that are still unsettled. One of the triggers is believed to be a food shortage in the region the consequence of drought and low grain yields in the Midwest U.S. and Canada. Russia, the main supplier grain to the Middle Eastern countries actually had crop failures due to drought. Now we see the worst drought in recorded history in California. Failures in their produce crops would have a seriously bad impact on U.S. grocery prices and the economy as a whole. I don't think anyone is about to stake their reputation on saying that these events were/are the result of climate change, but they they sure quack like a duck. These are more like what we will see, rather than NYC underwater up to the 39th floor. Climate change is real, and the Israelis did not knock down the WTC to get us to attack Iraq. |
| Bunkermeister | 06 Jun 2015 11:06 p.m. PST |
The California droughts are cyclical. We have doubled our population and did not add a single canal, reservoir, or desalinization plant in the state during that time. No surprise we don't have any water. Mike Bunkermeister Creek
Bunker Talk blog |
| goragrad | 06 Jun 2015 11:52 p.m. PST |
Oh my…Skeptical Science??? And dismissing Dr. Judith Curry's site as just a blog… Worst California drought in recorded history. Always sounds so authoritative to put that recorded history in the statement. Pity there was no European around to 'record history' during this (from the Deseret News in 1995) - Beginning about 1,100 years ago, what is now California baked in two droughts, the first lasting 220 years and the second 140 years. Each was much more intense than the mere six-year dry spells that afflict modern California from time to time, new studies of past climates show.The findings suggest, in fact, that relatively wet periods like the 20th century have been the exception rather than the rule in California for at least the past 3,500 years, and that mega-droughts are likely to recur.The evidence for the big droughts comes from an analysis of the trunks of trees that grew in the dry beds of lakes, swamps and rivers in and adjacent to the Sierra Nevada but died when the droughts ended and the water levels rose. Immersion in water has preserved the trunks over the centuries. Scott Stine, a paleoclimatologist at California State University at Hayward, used radiocarbon dating techniques to determine the age of the trees' outermost annual growth rings, thereby establishing the ends of drought periods. He then calculated the lengths of the preceding dry spells by counting the rings in each stump. This method identified droughts lasting from A.D. 892 to A.D. 1112 and from A.D. 1209 to A.D. 1350. Judging by how far the water levels dropped during these periods – as much as 50 feet in some cases – Stine concluded that the droughts were not only much longer, they were far more severe than either the drought of 1928 to 1934, California's worst in modern times, or the more recent severe dry spell of 1987 to 1992. In medieval times the California droughts coincided roughly with a warmer climate in Europe, which allowed the Vikings to colonize Greenland and vineyards to grow in England, and with a severe dry period in South America, which caused the collapse of that continent's most advanced pre-Inca empire, the rich and powerful state of Tiwanaku, other recent studies have found. Does Tiwanaku's fate await modern California? Stine, who reported his findings in the British journal Nature, says that California, like Tiwanaku, presents "a classic case of people building themselves beyond the carrying capacity of the land," which is determined not by wet times but by dry ones.
Highest average global annual temperature in the temperature record.
Of course that temperature record starts in the 1800s at the end of the Little Ice Age when the climatologists have decided there was enough global coverage to create a global average. Presumably your 'thousands of studies and millions of pages' is based on one or both of the 'consensus' studies that assessed 11,000 papers and found 97 percent 'consensus'
on human caused global warming. Seems that when the paper was read that turned into somewhat less that 200 papers by a dozen or so 'climate experts.' Its late and TMP will be shutting down soon, may pull up a couple of the analyses of those tomorrow, time permitting. |
| B6GOBOS | 07 Jun 2015 2:50 a.m. PST |
Did not know who Judith Curry was. Checked her blog. Did additional reading. Best summation found was on rational wiki. From there:
Judith Curry is a climatologist at Georgia Tech, infamous for flirting with the denier community on the basis that some of them have "good ideas" and can't get their contrarian papers published. For instance, she has posted on Anthony Watts' blog, as well as Steve McIntyre's Climate Audit. She has further embarrassed herself (and her university) by using refuted denier talking points and defending the Wegman Report, eventually admitting she hadn't even read it in the first place.[1] This and other shenanigans led Tamino of Open Mind to say, "Judith, your credibility is now below zero."[2] In short, she's the Richard Lindzen of the South. Or maybe the Roy Spencer of Georgia, take your pick.
Perhaps what has sparked the most criticism, more than any other one thing, is that she has invited McIntyre to talk at Georgia Tech. No, really.[3] This makes her a massive enabler.
Some other stuff she's been wrong about:
Maybe the Heartland Institute isn't so bad after all![4]
The BEST team tried to "hide the decline," because there has been "no warming since 1998." (This was widely quoted in a Daily Mail article.)[5]
(From the same Daily Mail article) "The models are broken." She later backed down about this on her blog, saying she was misquoted and "had no idea where it came from."[6]
Murry Salby is right about CO2 and every other scientist is wrong.[7]
This list could actually go on for much longer -- just go to her blog for more info. |
| mandt2 | 07 Jun 2015 8:20 a.m. PST |
Worst California drought in recorded history. Point taken. That said, consider the impact the drought is going to have on California agriculture, and what that will mean to the U.S. economy as a whole. California is one of the biggest (if not the biggest) food producer in the country. 80% of their water goes to agriculture. If the drought continues the consequences will be far reaching. And again, I'm not saying that climate change is to blame. I am just pointing out that this kind of thing is occurring with growing frequency, that appears to correlate with climate change. Oh my…Skeptical Science??? C'mon. Don't judge a book by it's cover. It's a compilation site of research articles, papers and analyses, boiled down so that you don't have to be a climate scientist to understand them. Stine, who reported his findings in the British journal Nature, says that California, like Tiwanaku, presents "a classic case of people building themselves beyond the carrying capacity of the land," which is determined not by wet times but by dry ones. That's a curious assertion since, as I said, 80% of CA's water goes to agriculture and food processing, and most of those products are exported to the rest of the country and around the world. So it's not the average CA resident is to blame. Of course that temperature record starts in the 1800s at the end of the Little Ice Age when the climatologists have decided there was enough global coverage to create a global average. Yeah, but climate science doesn't stop there. For example, ice core samples provide data on atmospheric chemistry and temperatures that go back 100s of thousands of years. Presumably your 'thousands of studies and millions of pages' is based on one or both of the 'consensus' studies that assessed 11,000 papers and found 97 percent 'consensus'on human caused global warming.Seems that when the paper was read that turned into somewhat less that 200 papers by a dozen or so 'climate experts.' Actually, that wasn't what I was referring to, but since you mention it here's the study in the flesh. So you can read it for yourself. link I'd be really interested where you got the "200 papers" and the "dozen or so climate experts" from. It would be enlightening to compare your source. I might have missed something Back to the original topic, and your response to the report. Let's assume the article on Judith Curry's site has merit. Now look at the graphs Martin posted. Let's assume that the earlier, "hiatus" numbers are the right ones. So, what's the difference? We are talking about tiny discrepancies over a short period of time that have little if any bearing on the long-term trend. It's as if two people on a 100-mile trek decided to walk on opposite sides of the street for a few blocks, and then got back on the same side again. But that's just the way research of any kind goes, large numbers of researchers trying to get at an answer and each using slightly different methodology. In the end, your analyses are much more robust than they would have been if all researchers looked at the very same bit of data, the very same way. |
|